
Covid-19/Sars-CoV-2 Report Week 20
The latest report of 2020-06-15 is at https://www.rangutan.eu/sars-cov-2-week-24/
This week's highlights:
Image 20.1 Covid Overview by World-Regions
Images 20.2a&b Graphs of G20 cases
Image 20.3 Covid Deaths per Million Citizens
Image 20.4 Covid Recovery rates
Image 20.5 Covid Cases Urban vs Rural
Image 20.6 Covid Table for Pollution Index
Image 20.7 Covid vs BMI/Obesity-Index
Image 20.8 Covid vs HIV
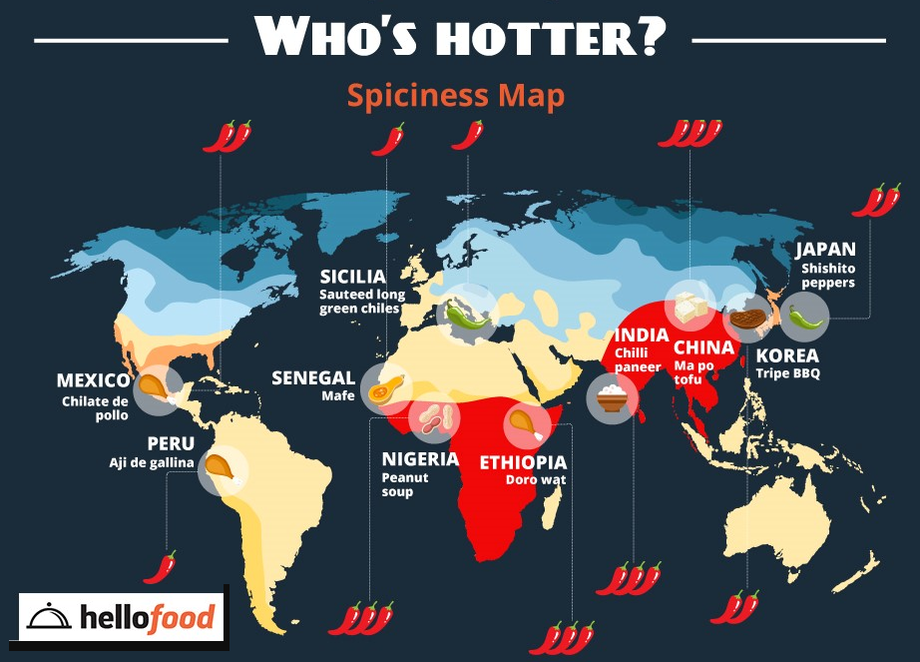
Images 20.9a&b HOT Spicy Foods plus Map
Bottom: Interesting screenshots and links
Image 20.1 Overview by Region Data from www.worldometers.com Red indicates above world median and green below median

Images 20.2a&b Graph of "Active" Cases in the G20 Nations


Image 20.3 Data sorted by Covid Deaths per Million Citizens (Column d/m) After 20 weeks of dispersion, most nations and dependencies are currently reporting less tha 4 deaths per million, eg: Singapore, Australia, India, Nigeria... Germany easing lockdowns at 95 deaths per million citizens.

Image 20.4 Data sorted by Covid Recovery rates (Column %r) Median recovery last week was 50% now this week 66% ... Iceland 99%, China 94%, UK now 50% and USA only 23% ...

Image 20.5 Covid Cases sorted by Urban (vs Rural) Percentage (Column "U-R" Source: Wikipedia) Obviously viruses spread easier in cities but why not easy in Macau or Puerto Rico? Average cases per thousand and average death rate in the three lists: High: 2.1 / 4.2 Middle: 1.6/ 4.3 Low: 0.2 / 3.2

Image 20.6a Covid Table sorted by Pollution Index (Column "toxic" Source www.numbeo.com) Average deaths per million for each column shown.
Very strange, the more green a country is, the higher the cases and deaths per million citizens! Average Pollution Index and average cases/deaths per thousand/million shown for each list: Top: 147 / 1/ 8 Middle: 109 / 1/61 Low: 53/ 11/140

Image 20.6b Map of Pollution Index Source: numbeo.com

Image 20.7 Covid vs BMI/Obesity-Index Here "BMI" is for adults only and "percentage obesity" for all ages. Obviously an issue being obese (like me) but middle weight nations ( middle table) shows most deaths per capita! The BMI excludes children and the population derivative includes children!
Averages for lists below: Left: 28/28/60 Middle: 26/20/89 Right: 23/ 6 / 7

Image 20.8 Covid vs HIV (Source CIA Factbook) Shown for the three tables are median HIV% in a population and average covid deaths per million citizens: Therefore, no evidence that HIV positive patients have higher covid deaths, in fact lower! Left: 1.5%/ 10 Middle: 0.3%/ 99 Right: 0.04%/ 35

Images 20.9a&b Coronavirus vs Countries that eat HOT Spicy Foods plus Map Youtube will delete any video that suggests that "turmeric" a.k.a urkuma/curcuma/haldi/gurkemeje cures viruses! Here are 66 countries where hot spices are regular part of daily nourishment and thier corona data:
... S1 = 15 hot spice nations meantioned in www.thedailymeal.com ... S2 = 51 additional counries in the zones marked in the hot map Image 20.7b below
World: population 7.8 billion people, with 320,000 covid deaths, means 41 deaths/million.
66 hot spicy nations: of 5.2 billion people, 21,000 deaths, means less than 4 deaths/million.
150 non-spicy nations: of 2.6 billion, with 299,00 deaths means 115 deaths/million.
Why? Have I made a mistake or is this real? Eat hot spicy food!

Images 20.10 Deleted
Image 20.11 Covid comparisons for City Population Densities in China No proof that cities of higher densities (like New York City) should have higher covid cases! Source: Woldbank

Image 20.12 Mortality in Metropolitan Areas High and therefore Rural Areas Low Source: Financial Times

Images 20.13 & 20.14 & 20.15 Screenshots from Highwire


New interstings links this week:
https://www.youtube.com/watch?v=2JbOvjtnPpE Perspectives on the Pandemic with journalist Sam Husseini
https://www.youtube.com/watch?v=T-5Zpmh6yPI Covid effects everyone by Robert Kennedy Jnr. (10min)
https://www.youtube.com/watch?v=zXW-WkU37rc Fauchi's Vaccines at HighWire with Del Bigtree
https://www.youtube.com/watch?v=2687MTU_uR4 The masks are off in USA by The Ingram Angle
https://www.youtube.com/watch?v=2DDXG-dHugc Funny song by Media Bear (4min)
https://youtu.be/QnsYcsCjLWI Gates attacked in Italian Parliament by Sara Cunial
https://www.facebook.com/rangutanshumour/photos/?tab=album&album_id=3278824068815330 Covi Humour
Confucius says: "He who wears face mask alone in car, also wears condom alone in bed." (Angela Stacy)
Summary of previous covid reports showing highlights:
Week 19 relook at Population Density, IT-reach, I.Q., 5G
Week 18 Recovery percentages
Week 17 Graphs per 1000 citizens
Week 16 Cases and deaths now per thousand, yearly flu visits.
Week 15 5G question
Week 14 Case update by IT-reach, average I.Q., pollution-indicies and by median age of a country.
Week 13 First recovery data, cases by world regions.
Week 12 Cases by north-south of latitude 27°N, questioning case and death numbers.
Week 11 Cases by IT-reach, average I.Q., pollution-indicies and by median age of a country.
Week 10 China 80% of cases, Cases worldwide by tourist-volume
Please see my health tips at: https://www.facebook.com/rangutanshealthtips/
and humour at: https://www.facebook.com/rangutanshumour/
Dr. Bergman's videos at: https://www.facebook.com/drjohnbergman/
The full updated and complete downloadable interactive (sortable-by-column) spreadsheet of my data, for all 239 countries and dependancies containing 20,000+ values. Open-source, please use, download, share https://docs.google.com/spreadsheets/d/1VfPUANZgXFF8SuRqcnGlRcu40vKC8CkC7fzsU3oJT_8/edit?usp=sharing
Worldometers: > https://www.worldometers.info/coronavirus/
BNO statistics: > https://bnonews.com/index.php/2020/02/the-latest-coronavirus-cases/
See also map showing infected towns and cities https://ncov2019.live/map by Avi Schiffman
Footnote: "If I get this virus I have only a 20% chance of survival? I belong to FOUR risk groups and live in the middle of a hotspot!" Perhaps I had "it" in January when I was horribly down with flu for three weeks? RRG2020
Matthew 18:20 "For where two or three gather in my name, there am I with them."
Thank you to all my readers. Special thanks to: BNOnews, Dr.B (both of them), The-Highwire, Statistika, CIA-Factbook, Worldometers, Wikipedia, Internetworldstats, Numbeo, Foxnews...
Drinking tea, how about a coffee? https://www.rangutan.eu/fund-me-please/