
SARS-CoV-2/Covid-19 Week 19
Disclaimer: The following report is my personal work, results and comments of my own research, should be looked at with an open mind and questioned. I am priveliged to enjoy press freedom but do not intend to upset anyone. I am not asociated with any political party or sect. Please let me know if there are any errors in my content. Covid-19 is a serious disease from which we should be protected, specially the older generation. Please obey all the rules set out by your government and local community.
The latest report of 2020-06-15 is at https://www.rangutan.eu/sars-cov-2-week-24/ Covid data this week is from www.worldometers.com
Image 19.1a Graph of ACTIVE CASES per thousand Citizens of selected countries (column EO/pop/1000) Unlike regular accumulated positive cases, this is "actual cases" per thousand citizens, excludes the dead and healed/immune citizens. Singapore has 22500 positive tested cases (20000 active) cases for a population of only 5.8 million and a recovery rate of only 10%, approaching 4 cases per 1000 citizen..... NYC ~ 20 per thousand. This graph should not look like spaghetti. Surely, the virus does not consider culture and every country should have similar curves? Not in this graph are places with higher cases/1000: Monserat 65, SanMarino 19, Andorra 10, Qatar 8, Luxemburg 6 and Gibralta 4 per thousand citizens.
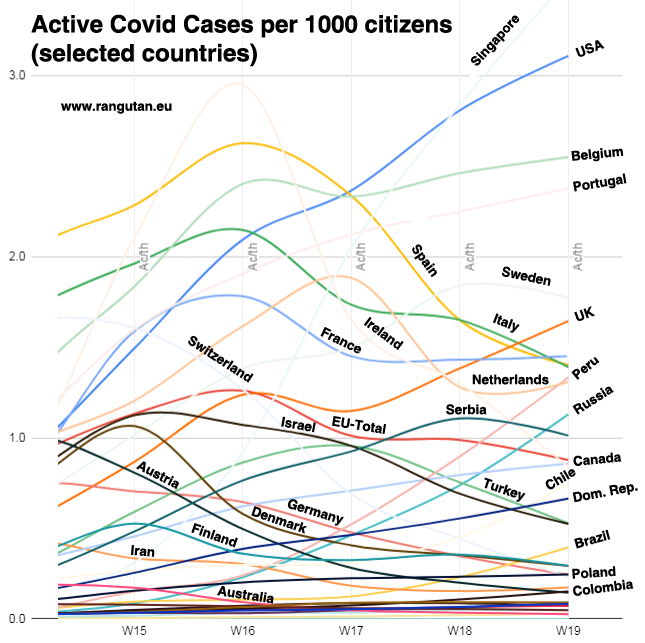
Image 19.1b Overview: Table of all current Active Cases (column "EL") 213 Countries & Dependencies. "Active Cases" are reported positive cases minus deaths and recoveries. It might be difficult to read this on a smart-phone but more graphs and links follow.
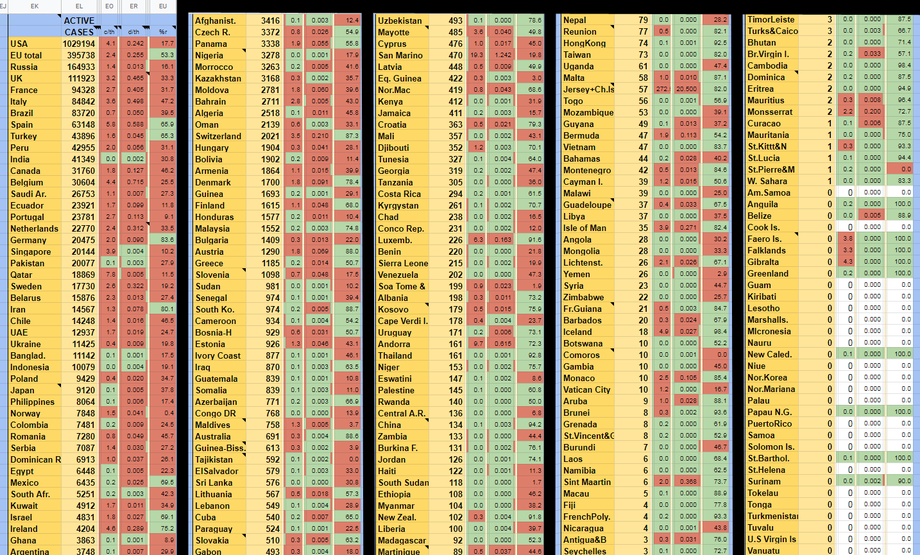
Image 19.3b Graph of Deaths per Thousand Citizens of selected countries
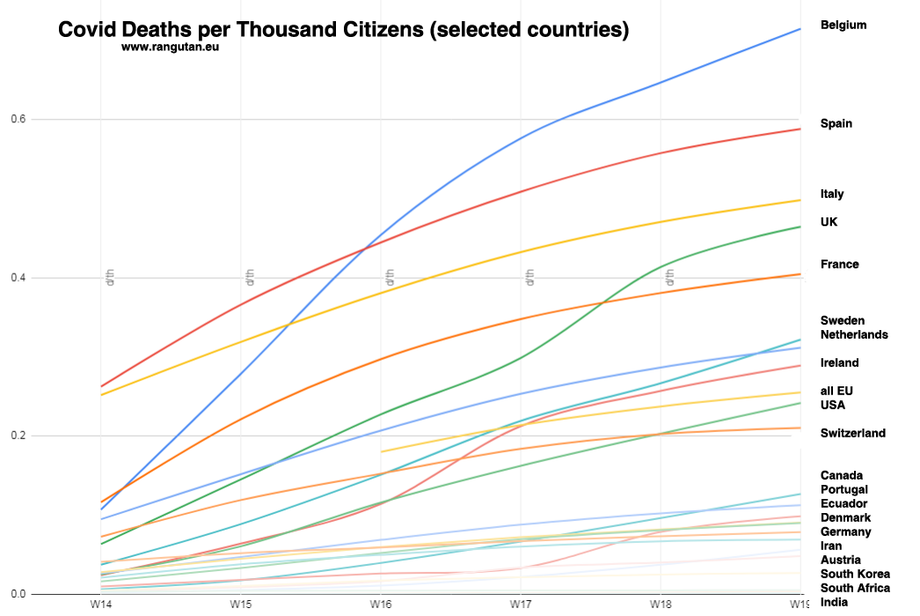
Image 19.3b Deaths per Thousand Citizens (All countries and Dependencies)
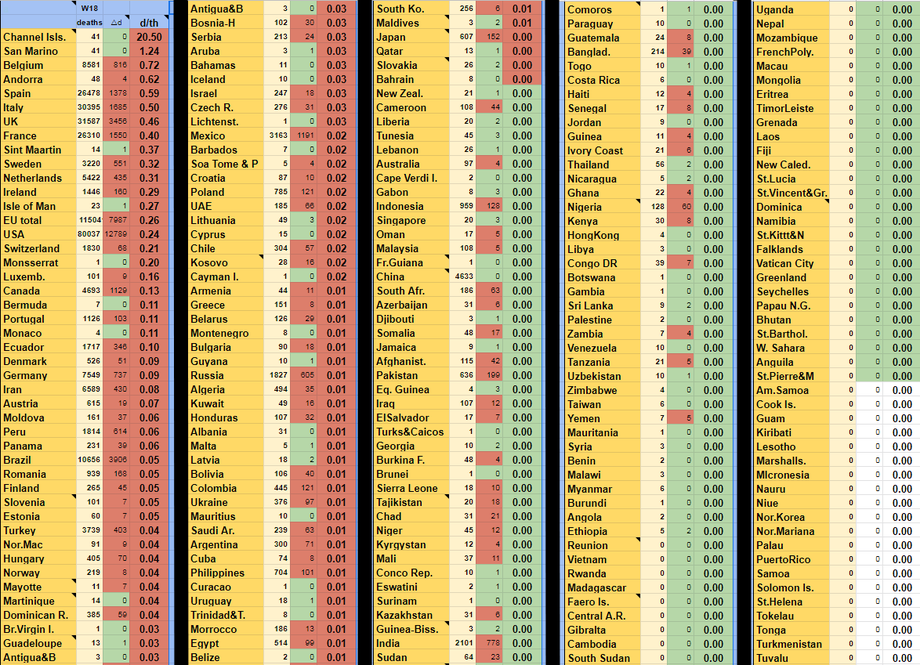
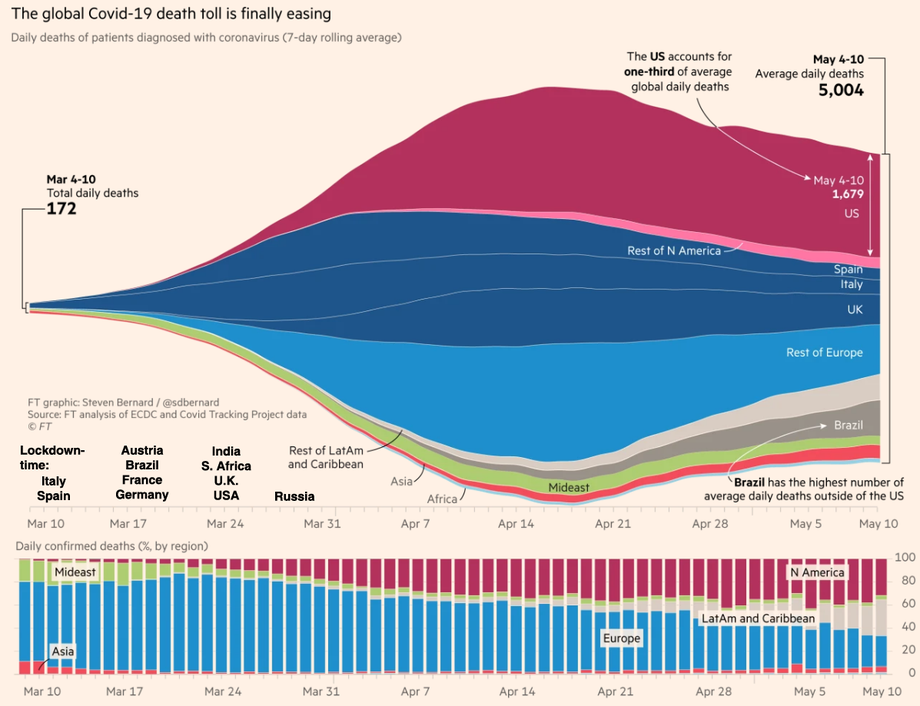
Image 19.3c Death-Toll Easing from Financial Times with lockdown times added
19.4 Graph of Progress of Recovery Percentages of selected Countries
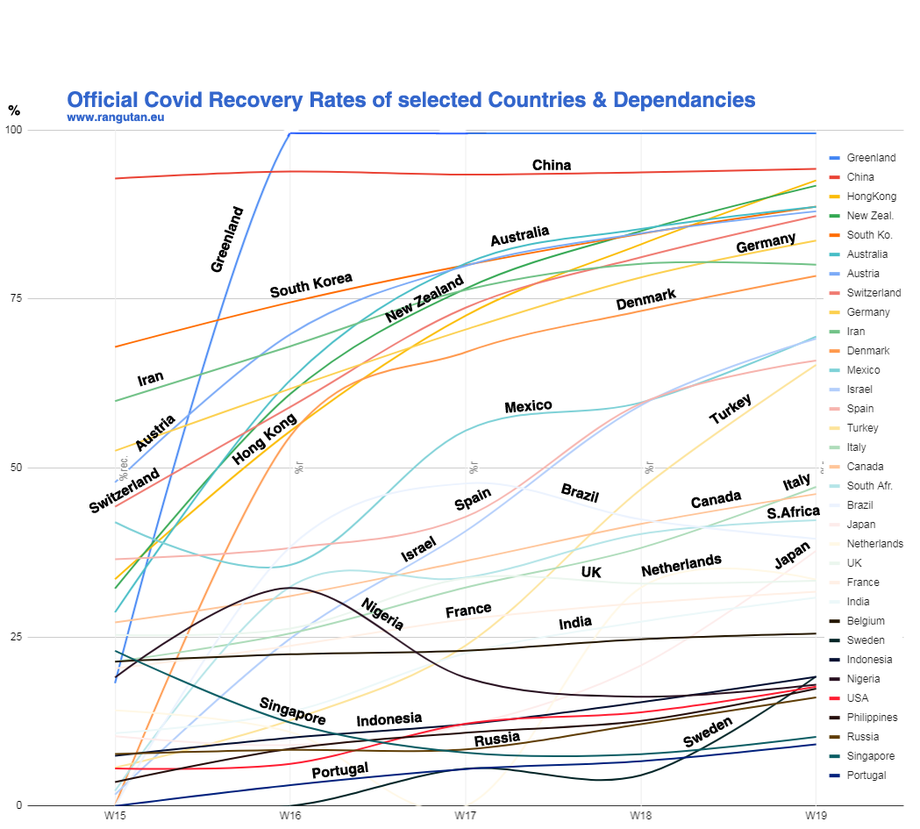
Image 19.5 Covid Cases by Country I.Q. Average Strange result! Covid preferes wiser nations? ... except asians in China, Taiwan, Mongolia, Vietnam and Mongolia! See also Image 14.7 in the Week-14 report.
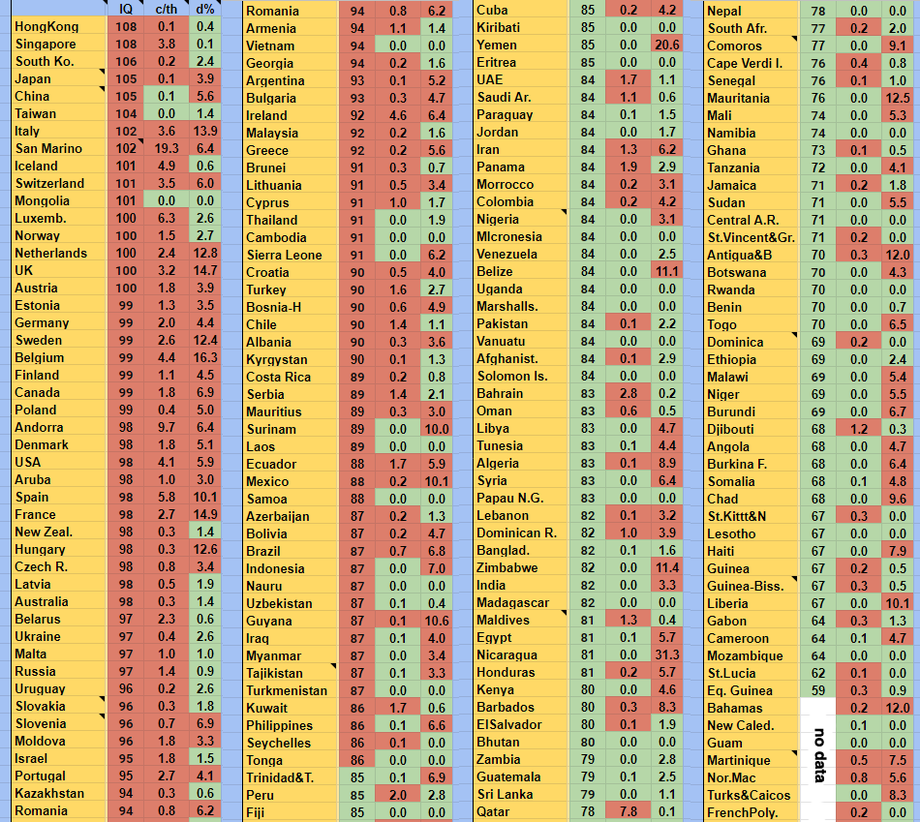
Image 19.6 Covid Cases sorted by Technology Index: Internet Penetration Shocking, covid chases technology! Median penetration is 72%, first half listed have far higher infections and far higher death rates! Internet % of population penetration 2020, source: www.internetworldstats.com. See also Image 14.6 in the Week-14 report.
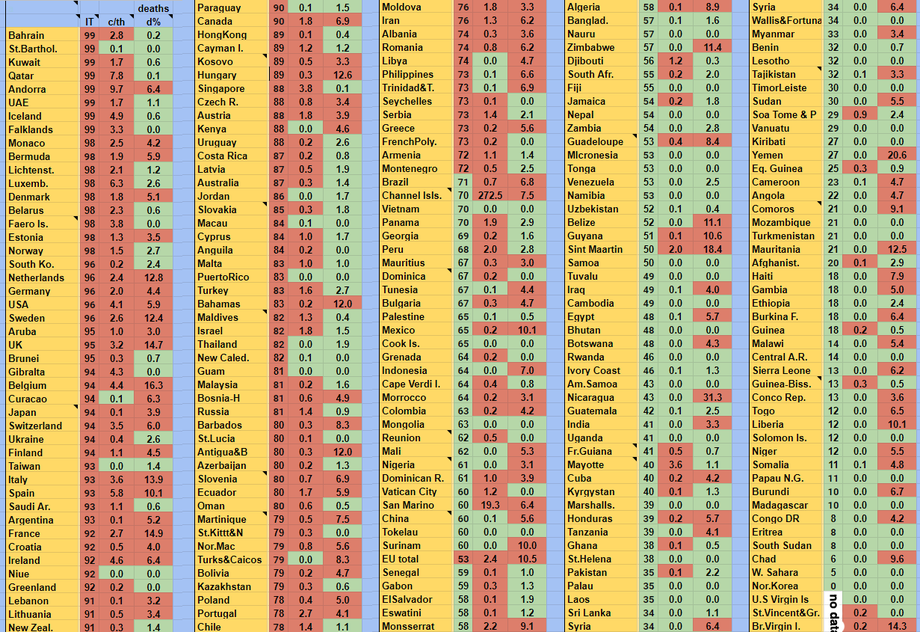
Image 19.7 Covid according to 5G Installations and Tests This was also reported in Week-15 as Image 15.8 ... 4.0 = Standard 4G 5.1 = testing 5.3 = trials 5.5 = commercial
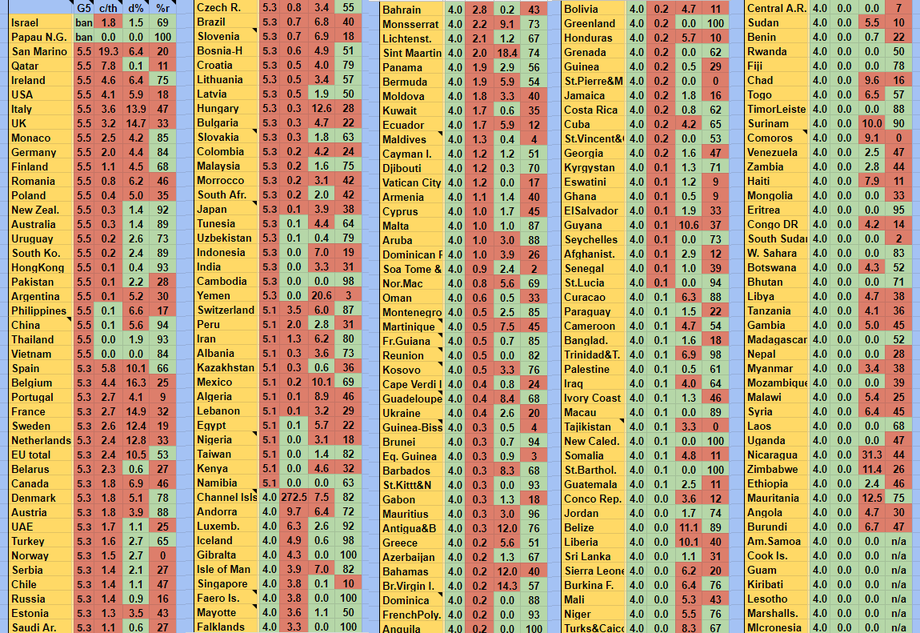
Image 19.8 Covid Countries by Population Density Any virus will spread quicker with higher population density, then why not in Macau, Bangladesh or Palestine? The median density is 98 citizens per square kilometer. The first half have 71 high case rates, the lower only 63.
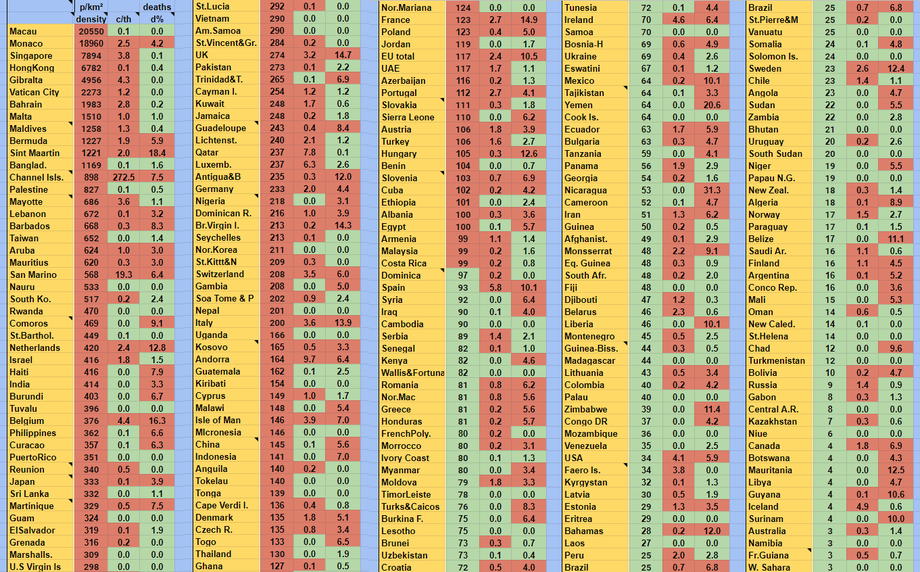
Image 19.11 Map from Andrew Mather
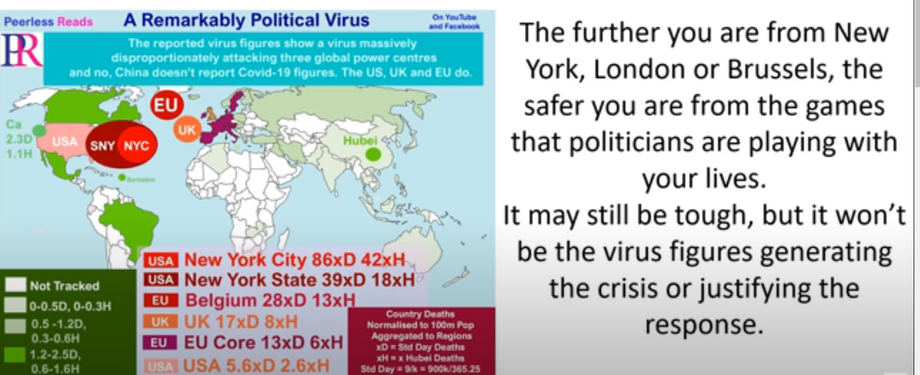
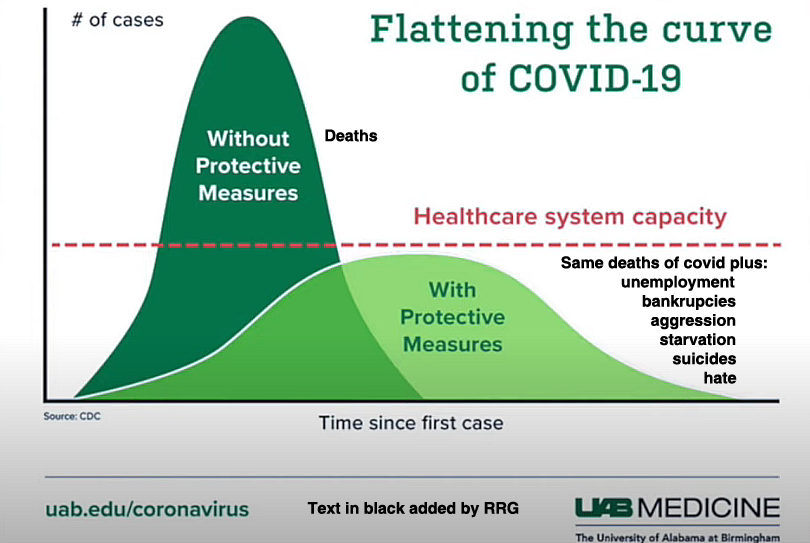
Image 19.12 Flattening the Curve from University of Alabama Thanks to Clive de Carle
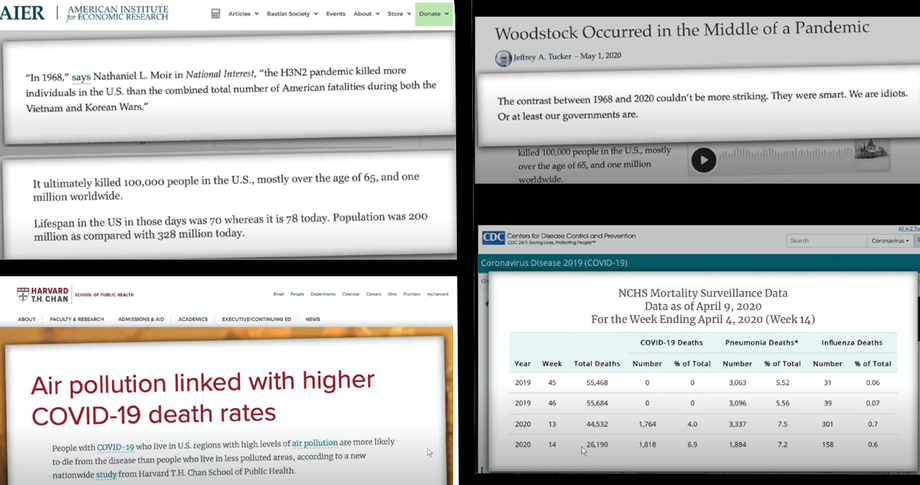
Screenshots from "Highwire"
Summary of previous reports showing highlights:
Week 18 Recovery percentages
Week 17 Graphs per 1000 citizens
Week 16 Cases and deaths now per thousand, yearly flu visits.
Week 15 5G question
Week 14 Case update by IT-reach, average I.Q., ...
Week 13 First recovery data, cases by world regions.
Week 12 Cases by north-south of latitude 27°N
Week 11 Cases by IT-reach, average I.Q., pollution
Week 10 China 80% of cases, Cases worldwide by tourist-volume
Please see my health tips at: https://www.facebook.com/rangutanshealthtips/
and humour at: https://www.facebook.com/rangutanshumour/
Dr. Bergman's videos at: https://www.facebook.com/drjohnbergman/
The full updated and complete downloadable interactive (sortable-by-column) spreadsheet of my data, for all 239 countries & dependancies containing 20,000+ values. Open-source, please use, download, share https://docs.google.com/spreadsheets/d/1VfPUANZgXFF8SuRqcnGlRcu40vKC8CkC7fzsU3oJT_8/edit?usp=sharing
Worldometers: > https://www.worldometers.info/coronavirus/
BNO statistics: > https://bnonews.com/index.php/2020/02/the-latest-coronavirus-cases/
See also map showing infected towns and cities https://ncov2019.live/map by Avi Schiffman
Footnote: "If I get this virus I have only a 20% chance of survival? I belong to FOUR risk groups and live in the middle of a hotspot!" Perhaps I had "it" in January when I was horribly down with flu for three weeks? RRG2020
Matthew 18:20 "For where two or three gather in my name, there am I with them."
Thank you to all my readers. Special thanks to: BNOnews, Dr.B (both of them), The-Highwire, Statistika, CIA-Factbook, Worldometers, Wikipedia, Internetworldstats, Numbeo, Foxnews...
Drinking tea, how about a coffee? https://www.rangutan.eu/fund-me-please/