
SARS-Cov-2 / Covid-19 Report for August 2020 ending Monday 2020-08-31
In my reports, I track tendencies of Covid-19, not only geographically but search for disproportions based on environment and nutrition. That way we can find a way to reduce the risk of dying of CoVid-19.
Prevention before cure!
"NOTE TO CENSORS: We use only government data. If you have a problem with the results, speak to the government!" (nice quote by Andrew Mather is true here too) If there should be an error in my data, please let me know! RRG
Last month's report for July is at: https://www.rangutan.eu/sars-cov-2-month-2020-07/
Contents:
- Image 36.1 Comparing Covid Deaths per 100,000 population in USA states with countries
- Image 36.2 Covid Numbers by Excess Deaths
- Image 36.3 Covid by World Region Sorted by Deaths-per-million status on 2020-08-31
- Image 36.4 Graph of CoVid-19 Death Rates of G20 nations
- Image 36.5 Covid vs Opiate Drug Use
- Image 36.7 Where are the deaths now?
- Images 36.8a&b&c Equi-Population Data for North/South/East/West Global Halves
- Image 36.9 Covid-19 in Germany by Robert Koch Institute
- Image 36.11 Covid-19 Deaths in German Bundesländer
- Image 36.12 Covid vs. All Deaths in Germany shows not much excess deaths this year!
- Image 36.13 Kids, youth and millenials are not dying of Covid-19 in Germany
- Image 36.14 Most deadly years in USA: 2020 #20 this century!
- Image 36.15 Hydroxychloroquine Effective in Prevention of Covid-19
- Image 36.16 Covid Crime Trials a la Nüremberg?
- Image 36.17 Abortion vs Covid
- Image 36.18 Spanish Flu 1918-1919 curves
- Interesting links in August for discussion
- Up-to-date Data Sources
- link to spreadsheet
- Previous Reports
- Humour
- Footnote
Image 36.1 Comparing Covid Deaths per 100,000 population in USA states with countries and other states

Image 36.2 Covid Numbers by Excess Deaths - not positively tested fatalities
This is brilliant, shows how many have died of all causes 2020 (red) vs. normal expected seasonal deaths.
While covid testing helps patients and doctors and is not reliable, this shows the real affect of covid on a city or nation since there are no other reasons for excess deaths like war or natural disasters.
For detailed mathematical results (all countries) see Andrew Mather's https://www.youtube.com/watch?v=AcfSZYYsU94
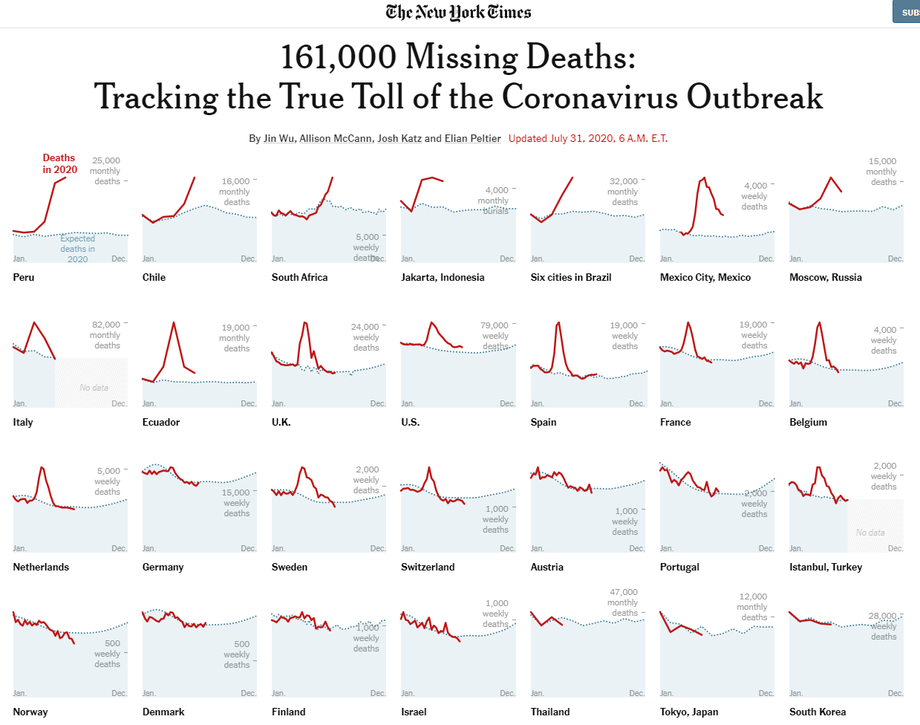
Image 36.3 Covid by World Region Sorted by Deaths-per-million at 2020-08-31
Showing Active cases, deaths per million citizens and recovery rates. No other stats really count!
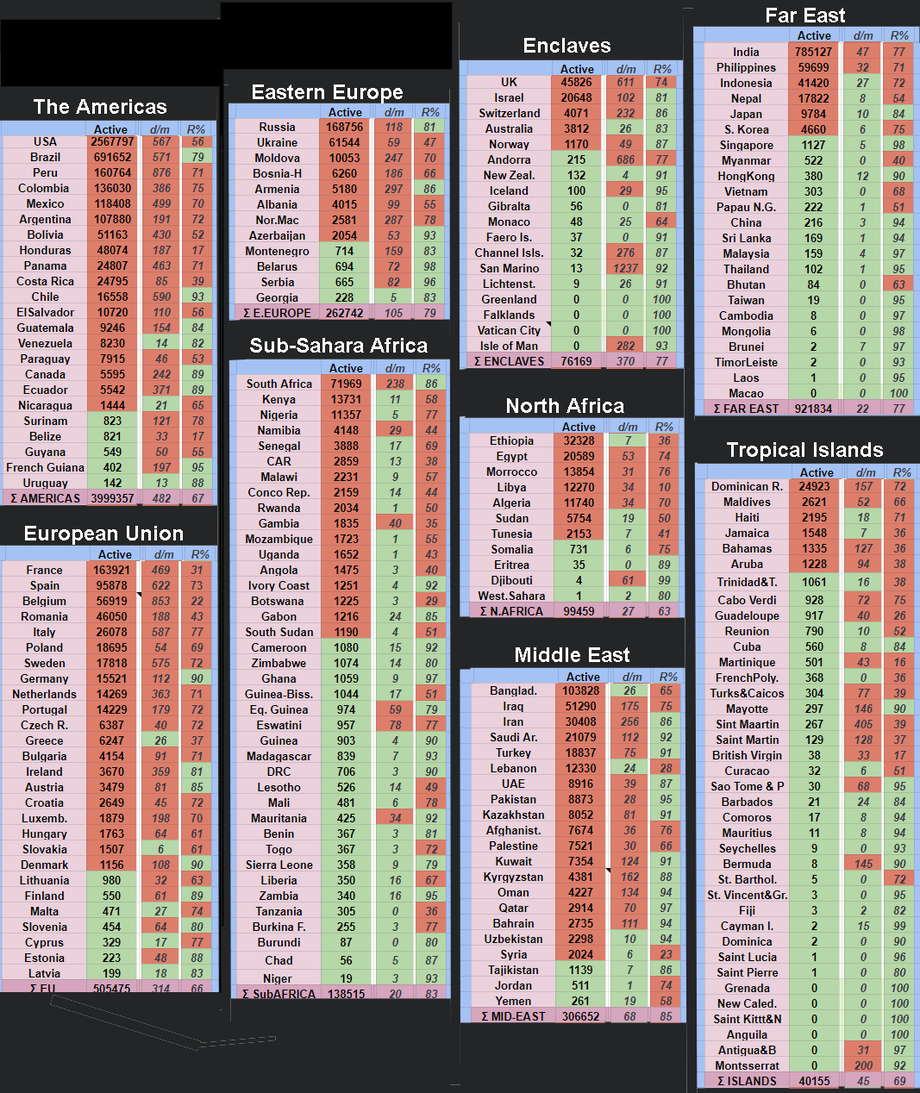
Image 36.4 Graph of CoVid-19 Death Rates of G20 nations
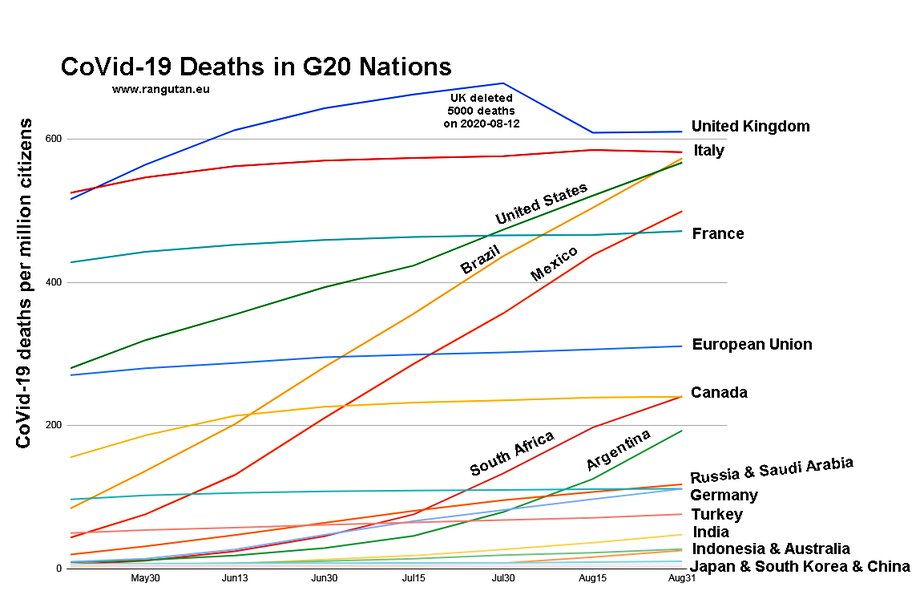
Image 36.5 Covid vs Opiate Drug Use
Since it is know that drug addicts have a far higher risk of AIDS that other HIV-positive tested persons,
this proves a similar outcome for Sars-CoV-2 positive tested people getting Covid-19!
Left: countries with high opiates usage Right: countries with low opiates usage
Median Deaths per million: 124 Median Deaths per million: 84

Image 36.7 Where are the deaths now? From "Wach Auf" (wake up)

Images 36.8a Case Numbers for Equi-Population Data of North/South/East/West Global Halves

Image 36.8b Maps showing Equi-Population Halves of the Globe for the graphs above and below
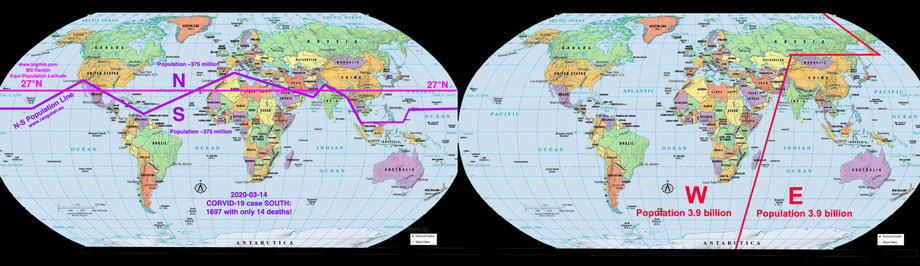
Images 36.8c Covid-19 rates for Equi-Population Data of North/South/East/West Global Halves

Image 36.9 Covid-19 in Germany by Robert Koch Institute 2020-09-01

Image 36.11 Covid-19 Deaths in German Bundesländer
Showing Life-Expectancy, Electro-Smog as internet "speed", amout of IT-experts, WLAN percentage use and I.Q. levels. Covid is obviously deadly for older folk in dense high-tech environments. This was proved in Image 19.5 - 19.7 in the report for Week-19 ... This should be researched and studied!
Red background is for above average figures and green below average. Red is obviously top-heavy!
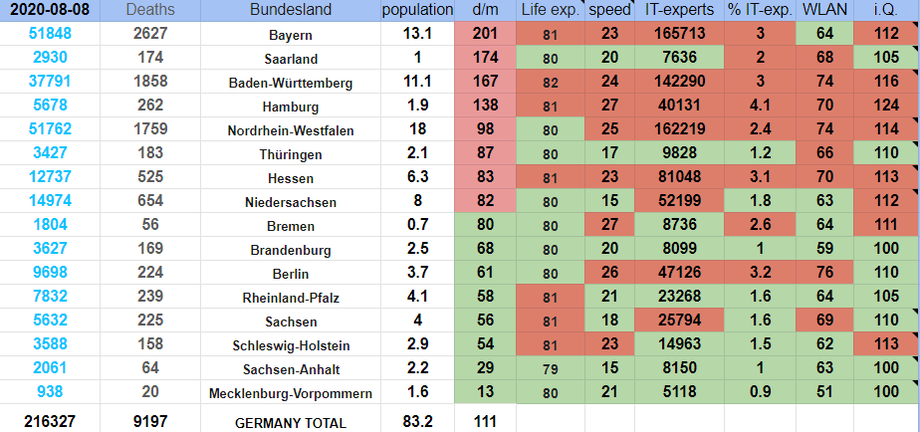
Image 36.12 Covid vs All Deaths in Germany shows not much excess deaths this year!

Image 36.13 Kids, youth and millenials are not dying of Covid-19 in Germany
Some "with" covid? ... but their lives are being destroyed by regulations.
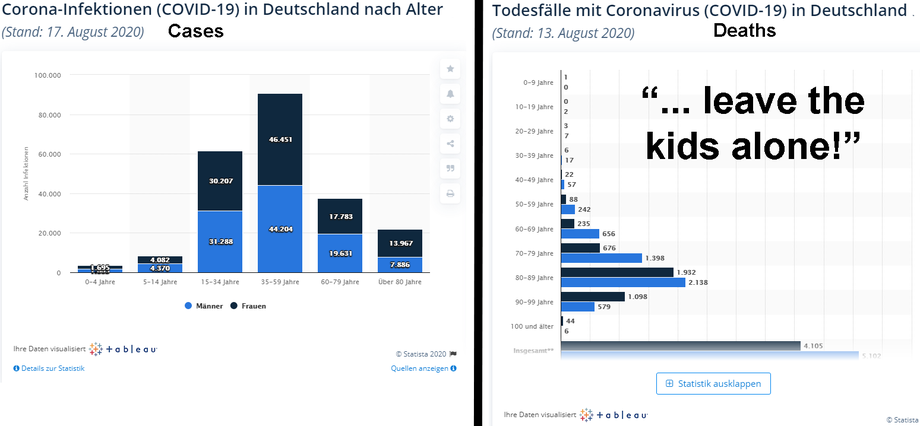
Image 36.14 Most deadly years in USA 2020 is #20 this century!
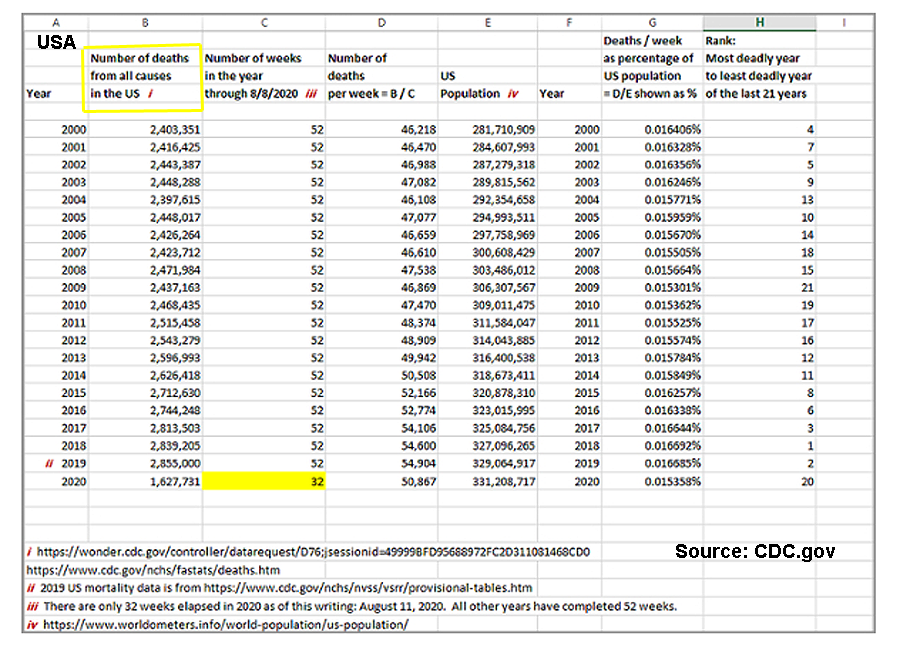
Image 36.15 Hydroxychloroquine Effective in Prevention of Covid-19
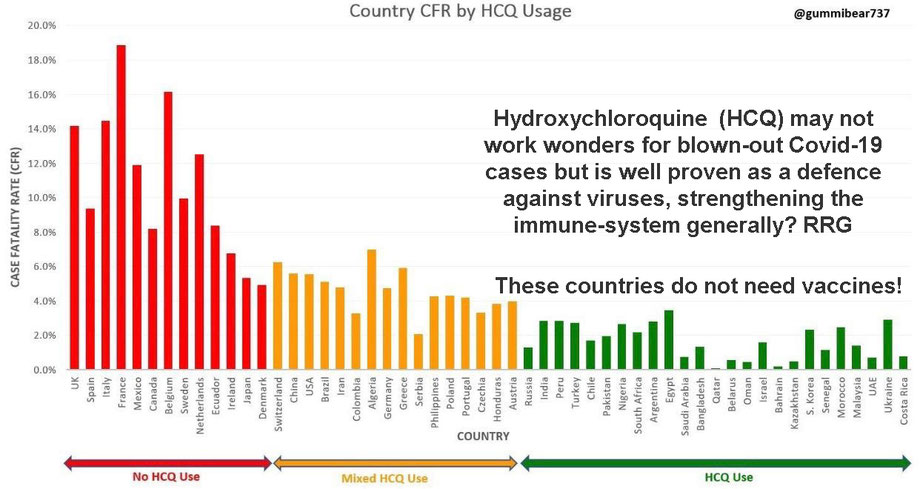
Image 36.16 Covid Crime Trials a la Nüremberg?
Denying/discouraging access to any alternative treatment is a crime. When Covid-19 is over as a pandemic, there should be a Nüremburg-type trail of those that mislead the public and destroyed economies, like Fauchi, Gates & Co! [Screenshot from "Gateway Punndit" link below]
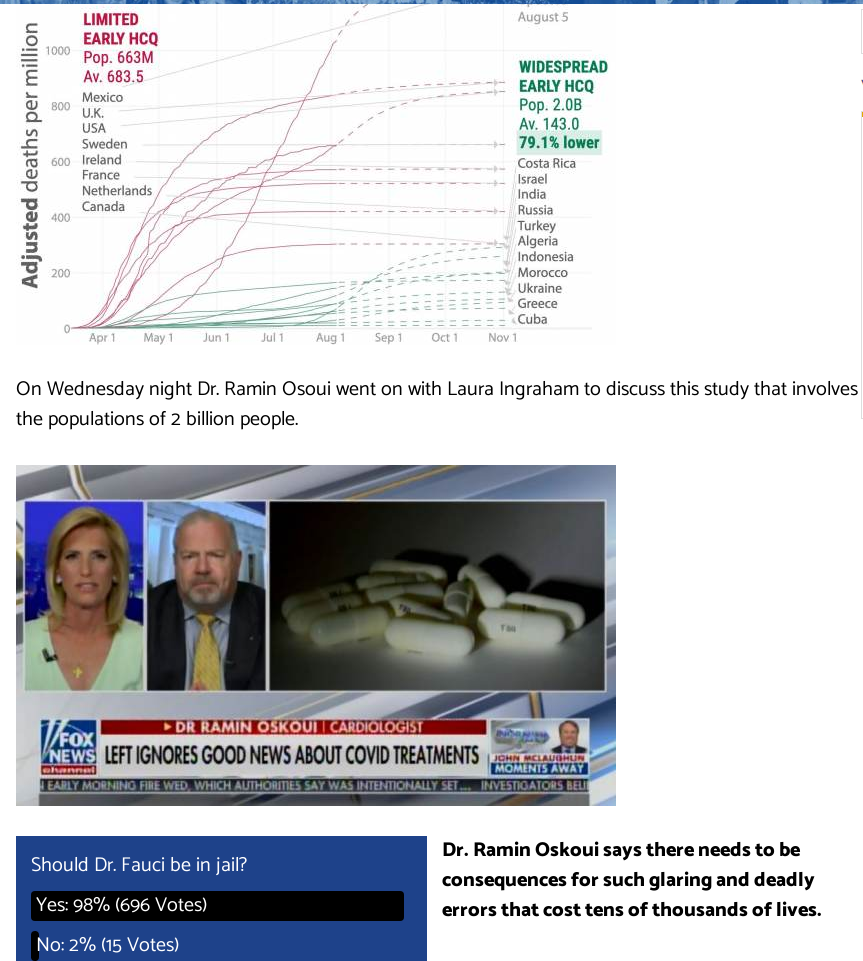
Image 36.17 Abortion vs Covid
Food or thought: If covid is all about preventing death then why does the government not ban abortion, limit sex and demand people wear condoms in public?
Live counter is at > http://www.numberofabortions.com/

Image 36.18 Spanish Flu 1918-1919

Most interesting links in August for discussion::
Meanwhile in London https://brandnewtube.com/watch/david-icke-039-s-speech-at-the-unite-for-freedom-rally-trafalgar-sq-london-aug-29_r2Ge8HFS1Ai7Gfd.html David Icke on Trafalgar Square
Meanwhile in Berlin https://www.youtube.com/watch?v=wM7NLlWZD5I Kennedy Jnr. in Berlin
Governments are preventing Heard Immunity https://www.youtube.com/watch?v=1iirfIvLCqk by Skeptikat
Swine-Flu lies all over again https://www.youtube.com/watch?v=2sYUcebv1NA Last American Vagabond (2hrs)
No deaths due to Covid-19 only https://youtu.be/LfeN68Zp-TY Prof. Klaus Püschel
Do we need a vaccine? https://www.youtube.com/watch?v=1YlL-MNmb1Y by Prof. Bhakdi (German)
The Delusion of Diagnoses https://www.facebook.com/drjohnbergman/videos/661030247844283/?sk=h_chr
Is there really a pandemic? https://www.greenmedinfo.com/blog/there-pandemic (text)
Meanwhile in Spain: https://youtu.be/SwlkumcRf6w
Some politicians and advisors should be jailed! https://www.thegatewaypundit.com/2020/08/jail-fauci-massive-international-study-shows-countries-early-hcq-use-79-lower-mortality-rate-huge-talking-120000-american-lives/
Fact checkers get sued https://www.youtube.com/watch?v=7TE3JbZbFhc by Collective Evolution (6 minutes)
More links by https://www.extremehealthacademy.com/the-truth-about-cv/?vgo_ee=YWatPfWNOYZhjXZ%2BQBjxdhwUnRnlmwiuCIJkd9A7F3A%3D thanks to Dr. John Bergman
Up-to-date Data Sources:
https://en.wikipedia.org/wiki/COVID-19_pandemic_by_country_and_territory (world)
https://covid19.who.int/table (world)
https://experience.arcgis.com/experience/478220a4c454480e823b17327b2bf1d4/page/page_1/ (Germany)
https://covid19data.co.za/provinces/ (South Africa)
If you would like to check my main spreadsheet of data, share it, check it or use it:
https://docs.google.com/spreadsheets/d/1KMaI1UXUc5V-5ZClbf7gTpRGz_c3HqBoJlUG_Ixu4hw
(Update September)
Previous reports:
Month July Mathematical proof that lock-downs are ineffective
Month June CoVid Update and Covid vs Country Life Expectancy
Week 24 Covid vs Country Average Age
Week 23 Tables, graphs and intermediate conclusions
Week 22 Why I do this! Updated tables & graphs
Week 21 Covid again by world regions, special graphs for the Americas and Africa
Week 20 Covid vs Chilli, obesity, rural vs urban
Week 19 Population Density, IT-reach, I.Q., 5G
Week 18 Recovery percentages
Week 17 Graphs per 1000 citizens
Week 16 Cases and deaths now per thousand, yearly flu visits.
Week 15 5G question
Week 14 Case update by IT-reach, average I.Q., pollution-indicies and by median age of a country.
Week 13 First recovery data, cases by world regions.
Week 12 Cases by north-south of latitude 27°N, questioning case and death numbers.
Week 11 Cases by IT-reach, average I.Q., pollution-indicies and by median age of a country.
Week 10 China 80% of cases, Cases worldwide by tourist-volume
Some humor:


Footnote:
Serious, I belong to 5 of 8 CoVid-19 risk groups and am sure to die soon. Please quarantine the Covid-19 postive tested people and lockdown us old and sensitive groups for a few weeks or months but please let the general public live, work and play. Covid-news is all about fear of dying but in most countries and communities there are not excess deaths because of the coronavirus. The sooner we all get Covid-19 and heal, the sooner this whole circus joke is over. The economic crash is criminal! RRG2020