
COVID-19 Report for Week-14 ending 2020-04-04
The latest report of 2020-06-15 is at https://www.rangutan.eu/sars-cov-2-week-24/
I do not work or anyone, neither am I being paid to do this. It is a hobby for me to search for truth and reasons..
Here, COVID-19 case-statistics are expanded to include geographic & demographic data to find any possible tendencies and causes. This is amateur work, I hope professionals or institutions will do it better. Note: the reported case numbers relate to SARS-CoV-2 virus positive tests. Only a fraction of these "cases" leed to a noticible COVID-19 disease. There are very likely millions of unreported cases!
This week's highlights with 12 images and notes includes:
- world hits 1 million plus COVID-19 cases! USA now hardest hit!
- case numbers compared with air pollution and electro-smog indices!
- COVID-19 data by population density and percent urban population does not show a relation!
- strangly, worst hit countries are those of high I.Q average and advanced Information Technology!
- countries below 27° latitude are still mildly infected!
- a bit of trivia too!
There are some interesting links at he bottom of this page and a link to my whole original spreadsheet.
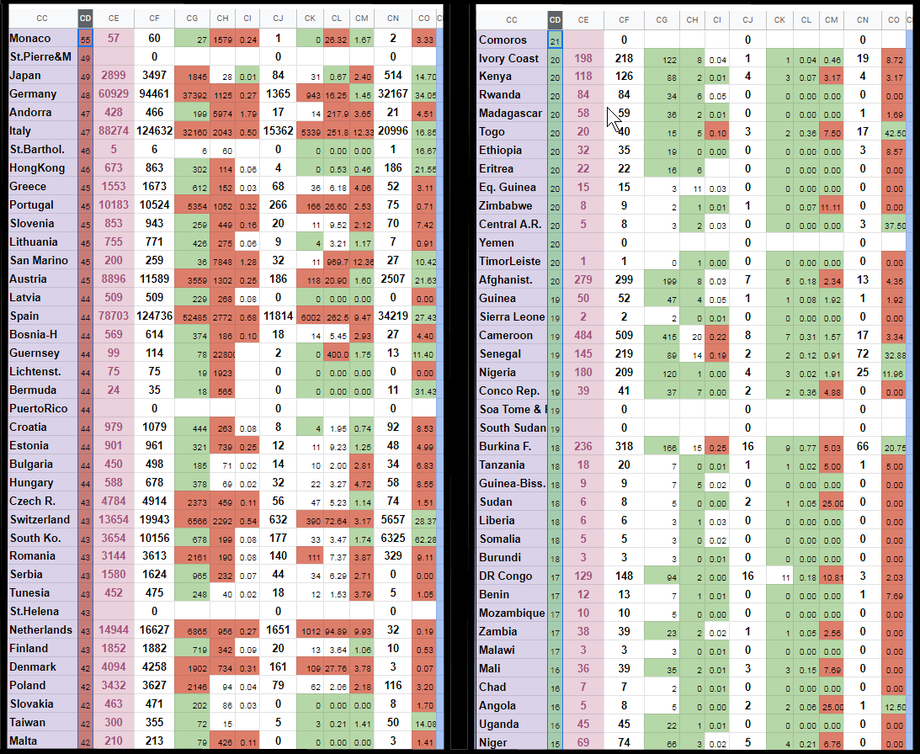
Images 14.1a and 14.1b REAL Active Cases (excludes deaths and recoveries) Column "CD"
China now #29 having 92% recoveries (officially).
Tabelle on the right-hand-side shows bottom 37 countries & dependencies not recording one single case (yet).
In the right-hand table, Column C duplicated as column CD shows populations living COVID-19 free, totalling 149 million citizens!
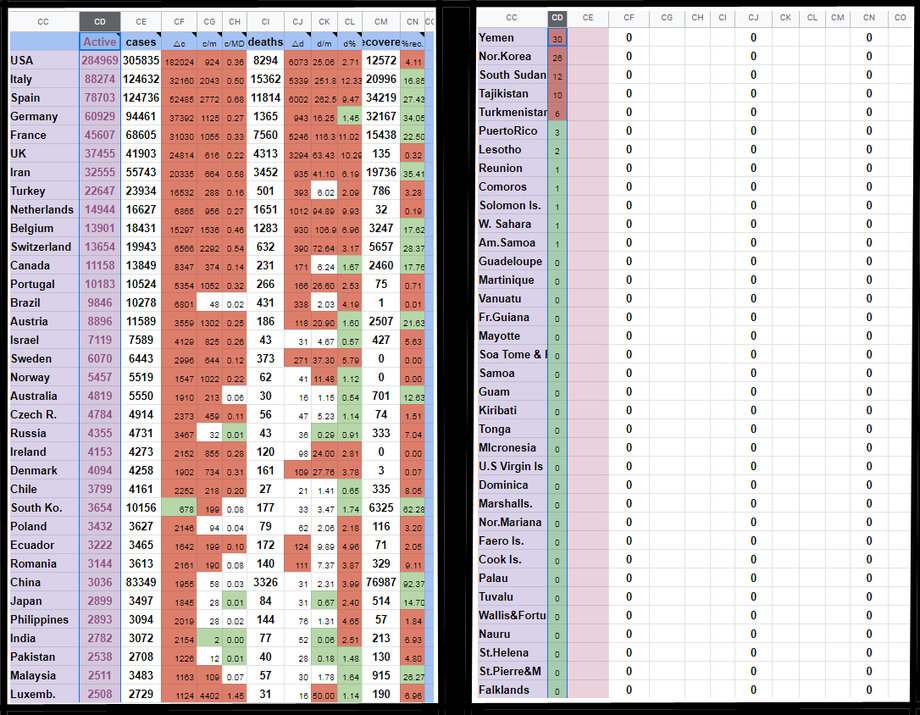
Image 14.2 COVID-19 Cases per Million Population (Column CH)
The first seven are small islands and enclaves. So let's rather give the positve case as per THOUSAND citizens :
Jersey 63 per thousand, Guernsey 23, San Marino 8, Andorra 6, Luxembourg 4, Iceland 4, Gibralta like Spain 3.
Italy has 2 cases per thousand and USA under 1 case per thousand!
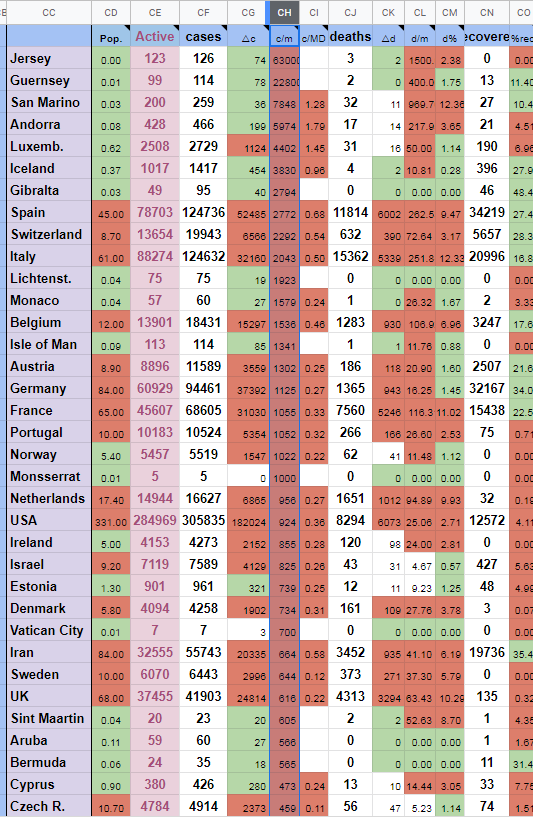
Image 14.3 COVID-19 Deaths per Million Population (Column CL)
China, at #59 not on this table, with 2.31 deaths per million.
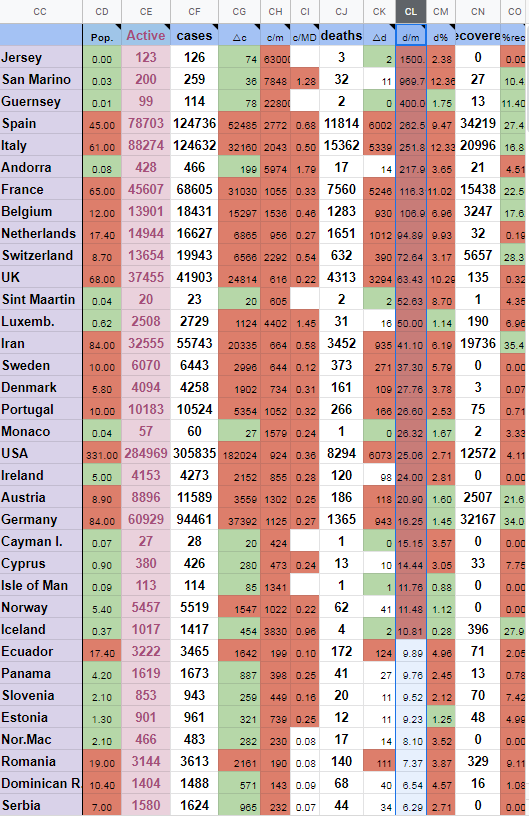
Image 14.4 Top COVID-19 Death Percentages (Column CM)
It is said this can vary very much as some mild cases are never tested/recorded as positive, therefore not reported ... and some deaths are really caused by other prevailing diseases. death rate on the very well managed cruiseship "Diamond Princes" was only 1%. Passengers were older, average age 65, but reasonably in health on boarding and all were tested during the ordeal, even multiple times.
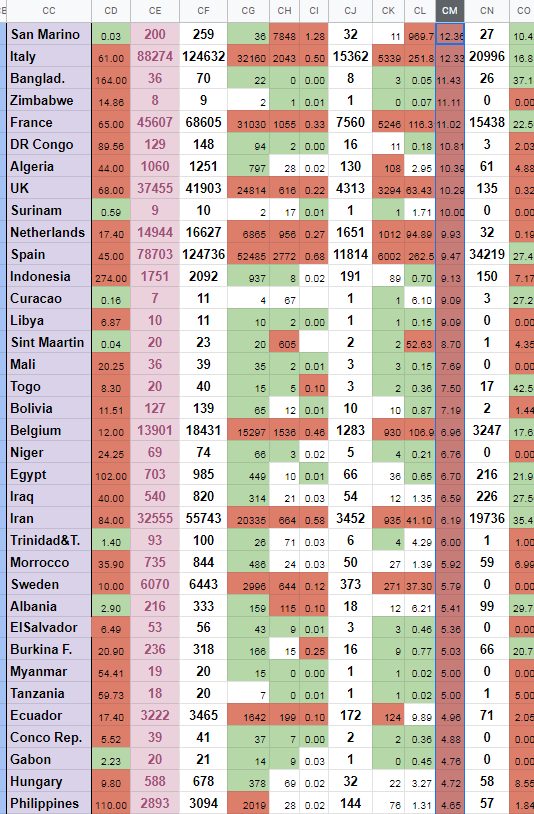
Image 14.5 Top Recovery Rates (Column CO)
Great news and generates hope:
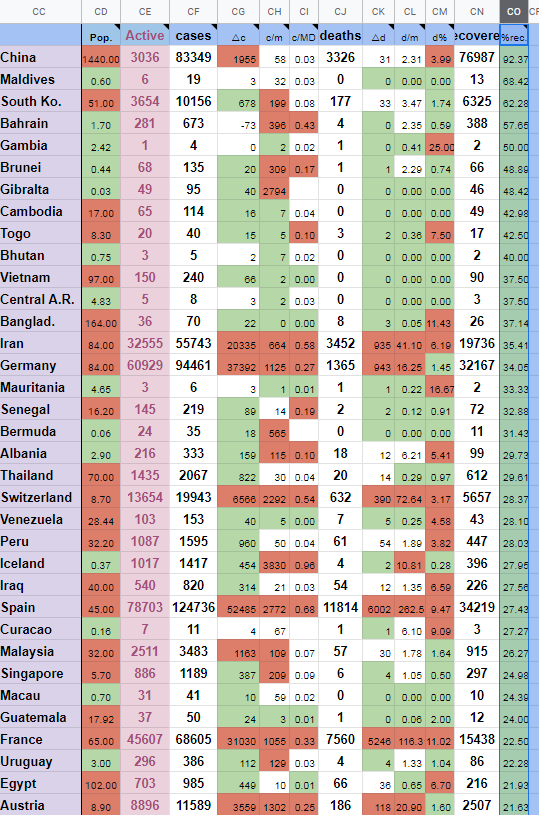
Image 14.6a and 14.6b COVID-19 cases by IT-reach (Column S=CE)
Very strange, COVID-19 is hitting countries hardest with high IT knowlege, hardware and networking.
The middle countries not seen here, with 50-80% IT, have a population of 3.5 billion and cases totalling 212,000
Population Left: 1.5 billion have 945,000 cases Population Right: 2.8 billion have only 11,000 cases
IT-coverage is between 81% to 99% IT-coverage is between 0% and 50%
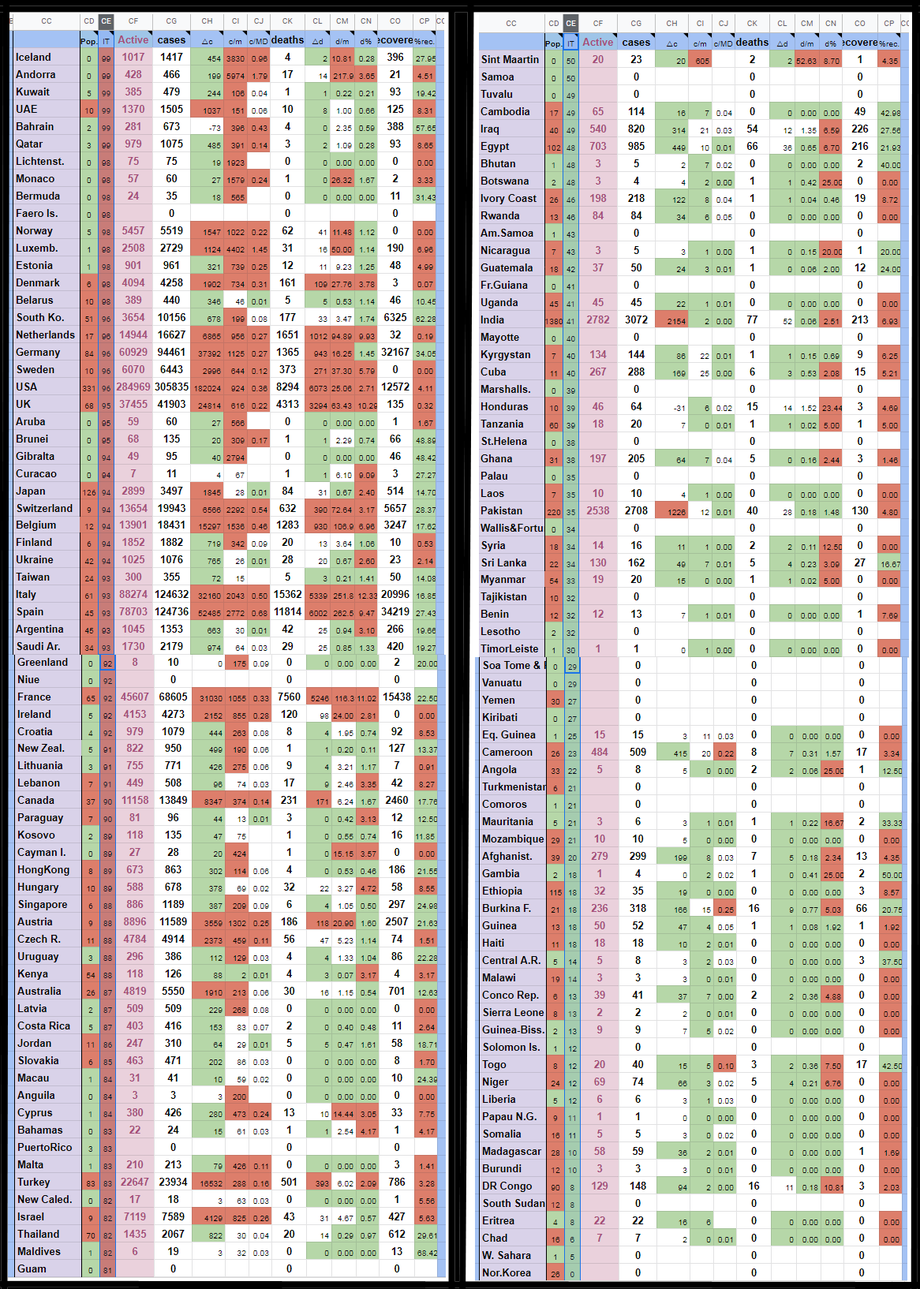
Image 14.7a and 14.7b COVID-19 by I.Q. (Column T=CE)
Shocking! COVID-19 chooses to infect people of high intelligence-quota! Because of travel? Electro-smog?
The middle countries not seen here with 4.3 billion have an average I.Q. of 96 to 77 and cases totalling 177,300
On the left, top 35 counries by average I.Q. 108 to 97 On the right lowest 35 countries of average I.Q. of 76 to 59
Population 2,7 billion, 987,000 cases Population 579 million, 1889 cases
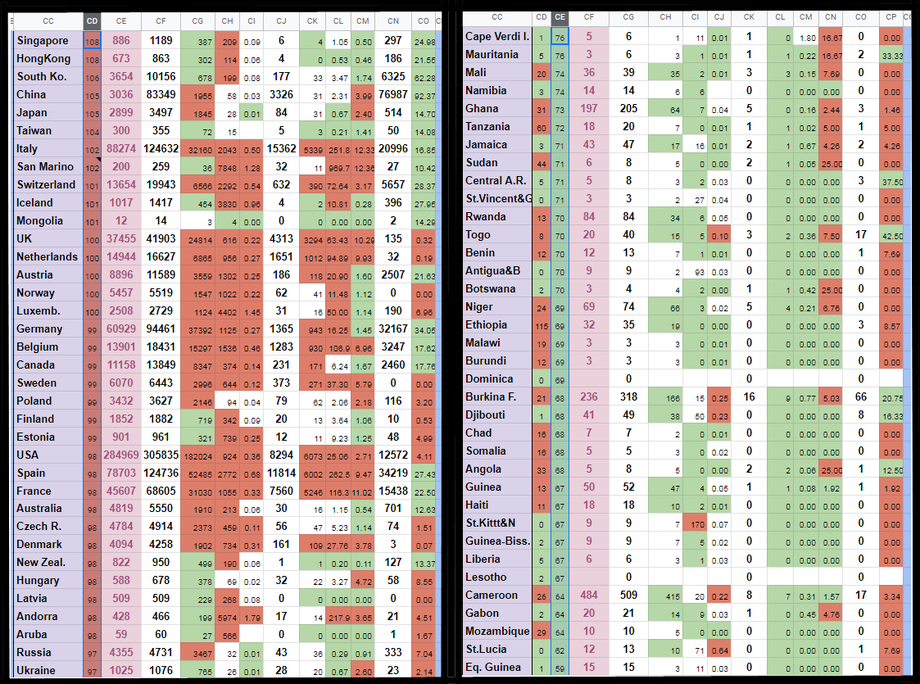
Image 14.8a and 14.8b COVID-19 by Pollution (Column R=CD)
I would expect citizens in badly polluted countries to have weak lungs and suffer more with COVID-19
Surprisingly the opposite.
Left: 35 of the least polluted countries Right: 35 of the most polluted countries
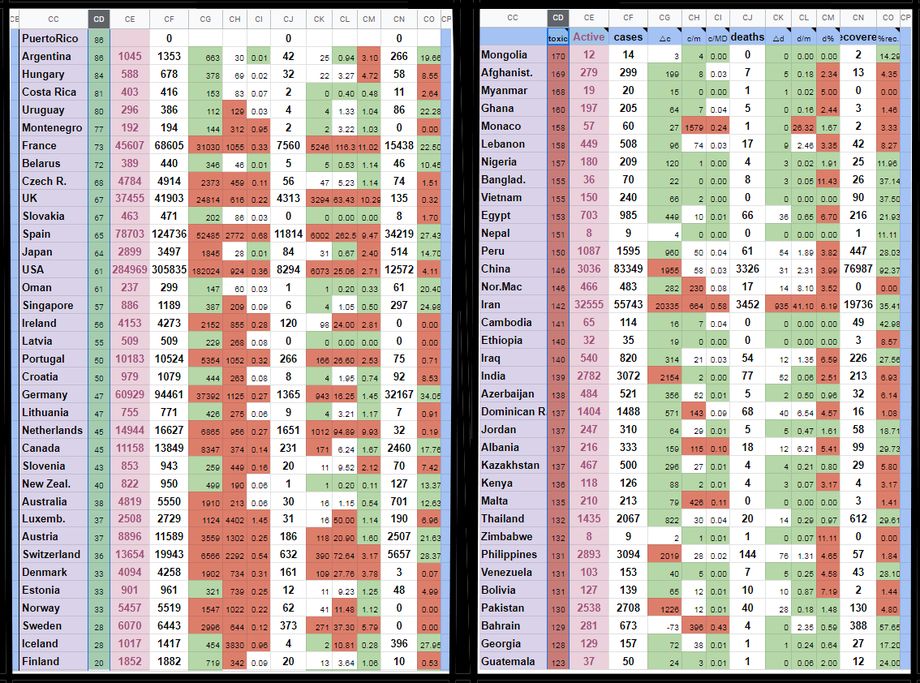
Image 14.9a and 14.9b COVID-19 by Median Age of a Nation (Column K=CD)
It would make much more scence to isolate old and vulnerable people rather than destroy everyones life!
Left: Countries with median age from 55 to 42 Right: countries with the youngest populations 21 to 15
The full and complete interactive (sortable-by-column) spreadsheet of this data, for all 238 countries and dependancies, is at: https://docs.google.com/spreadsheets/d/19J8W8oRUUOZUVlLj-SCSxxBdbg2j4sHqqqksa90MVaI/edit?usp=sharing Open-source, please use, share and improve.
I am human. Please let me know if you find errors here. Accuracy not 100% guaranteed.
BNO statistics: > https://bnonews.com/index.php/2020/02/the-latest-coronavirus-cases/
See also map showing infected town and cities by Avi Schiffman https://ncov2019.live/map
I would like to see data/numbers on people tested NEGATIVE. Does anyone have such statistics?
Keep safe at home and remember to take vitamin-C suppliments and get a lot of vitamin-D (sunshine) to strengthen your immune system. More health tips at https://www.facebook.com/rangutanshealthtips/ and meditation/prayer/faith at https://www.facebook.com/rangutansreligionsunite/
Celebrities tested positive: Boris Johnson, Angela Merkel, Prince Charles, Tom Hanks...
https://www.wikifame.org/wiki/Celebrities-Tested-Positive-for-Coronavirus-COVID-19
Wise words from Prof. Sucharit Bhakdi > https://www.youtube.com/watch?v=LsExPrHCHbw
Fund me please! https://www.rangutan.eu/fund-me-please/
My next update is on Sunday 2020-04-12 for calender-week 15 (hopefully) SARS-CoV-2 Week 15
Isaiah 26:20 " Go, my people, enter your rooms and shut the doors behind you; hide yourselves for a little while until His wrath has passed by."
Footnote: "If I get this virus I have only a 20% chance of survival. I belong to FOUR risk groups and live in the middle of a hotspot!" Perhaps I had in January when I was horribly down with flu for three weeks? RRG2020